Cursor Insert India
Data Analytics Using Tableau

Data Analytics Using Tableau
Course Description
Module 1: Introduction to Data Analytics and Tableau
- What is Data Analytics?
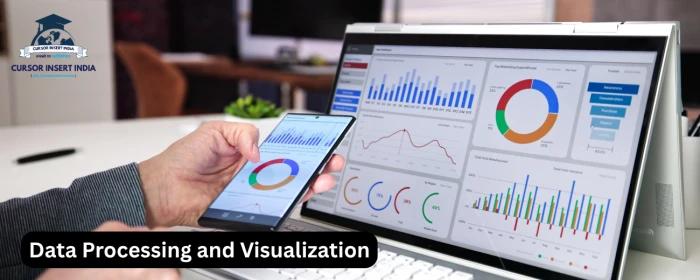
- Importance of Data Visualization in Analytics
- Introduction to Tableau and Its Features
- Tableau Installation & Interface Overview
- Understanding Data Connections in Tableau
Module 2: Data Preparation & Connection
- Connecting to Different Data Sources (Excel, CSV, SQL, Web Data)
- Data Blending vs. Data Joining
- Working with Live vs. Extract Data
- Data Cleaning and Transformation in Tableau Prep
Module 3: Data Manipulation & Calculations
- Dimensions vs. Measures
- Data Types and Hierarchies
- Creating Custom Calculated Fields
- Using Table Calculations
- Aggregation and Granularity
- LOD (Level of Detail) Expressions
Module 4: Basic Data Visualization
- Creating Basic Charts:
- Bar Chart, Line Chart, Pie Chart
- Scatter Plot, Histogram, Heatmap
- Sorting, Filtering, and Grouping Data
- Using Colors, Labels, and Tooltips for Better Visualization
Module 5: Advanced Visualization Techniques
- Dual-Axis & Combined Charts
- Maps and Geographic Data Visualization
- Tree Maps & Bubble Charts
- Waterfall Charts & Gantt Charts
- Motion Charts for Time-Based Data
Module 6: Dashboard & Storytelling in Tableau
- Designing Effective Dashboards
- Adding Filters & Actions to Dashboards
- Creating Interactive Dashboards
- Storytelling with Data: Building a Storyboard
- Best Practices for Dashboard Design
Module 7: Working with Parameters & Advanced Filters
- Creating and Using Parameters
- Dynamic Filters & Slicers
- Cascading Filters and Dependent Dropdowns
- Advanced Date Filters
Module 8: Statistical & Predictive Analytics in Tableau
- Trend Lines and Forecasting
- Reference Lines & Bands
- Statistical Summaries (Mean, Median, Standard Deviation)
- Clustering & Segmentation
- Predictive Modeling Using Tableau
Module 9: Integration & Automation
- Connecting Tableau with R & Python
- Using Tableau with SQL Databases
- Automating Reports and Extract Refreshes
- Publishing and Sharing Dashboards
Course Syllabus
1: Introduction to Data Analytics and Tableau
2: Data Preparation & Connection
3: Data Manipulation & Calculations
4: Basic Data Visualization
5: Advanced Visualization Techniques
6: Dashboard & Storytelling in Tableau
7: Working with Parameters & Advanced Filters
8: Statistical & Predictive Analytics in Tableau
9: Integration & Automation
Duration: 3 Months Months
(0 Reviews)
0 Ratings
Course Creator: Cursor Admin